Examples
To run the examples, you need to install matplotlib and plotly. Using pip, you can install them with the following command:
pip install matplotlib plotly
TIME_SERIES curve examples
Simple example how to read a TIME_SERIES curve ([view on github] ,
[download])Aggregation example ([view on github] ,
[download])Aggregation example - changing timezones ([view on github] ,
[download])Filter example ([view on github] ,
[download])Read multiple curves and save them as csv ([view on github] ,
[download])
TAGGED curve examples
No example yet
INSTANCE curve examples
Simple example how to read an INSTANCE curve ([view on github] ,
[download])Get multiple instances ([view on github] ,
[download])Get latest instance ([view on github] ,
[download])Get multiple instance curves and save them as csv ([view on github] ,
[download])Simple example on how to get a relative forecast ([view on github] ,
[download])
TAGGED_INSTANCE curve examples
Simple example how to read a TAGGED_INSTANCE curve and get available tags ([view on github] ,
[download])Read data for multiple tags ([view on github] ,
[download])Get multiple instances ([view on github] ,
[download])Get latest instance ([view on github] ,
[download])
Listening for changes example
Listening for changes for several Solar and Wind curves and append new data to a csv file for each new event ([view on github] ,
[download])
General examples
Comparing PV forecast and actuals ([view on github] ,
[download])Combining Series to DataFrame in pandas ([view on github] ,
[download])Saving pandas Series and DataFrames to csv and xlsx ([view on github] ,
[download])Aggregation examples using pandas ([view on github] ,
[download])
Intraday examples
Simple example on how to get the intraday price forecast. ([view on github] ,
[download])Example on how to get the absolute forecast for the intraday price. The absolute forecast shows the price development over time for a specific contract. ([view on github] ,
[download])Example on how to create lead time analysis plots. These plots show how the difference between a chosen benchmark forecast and one of our intraday forecasts develops over time ([view on github] ,
[download])
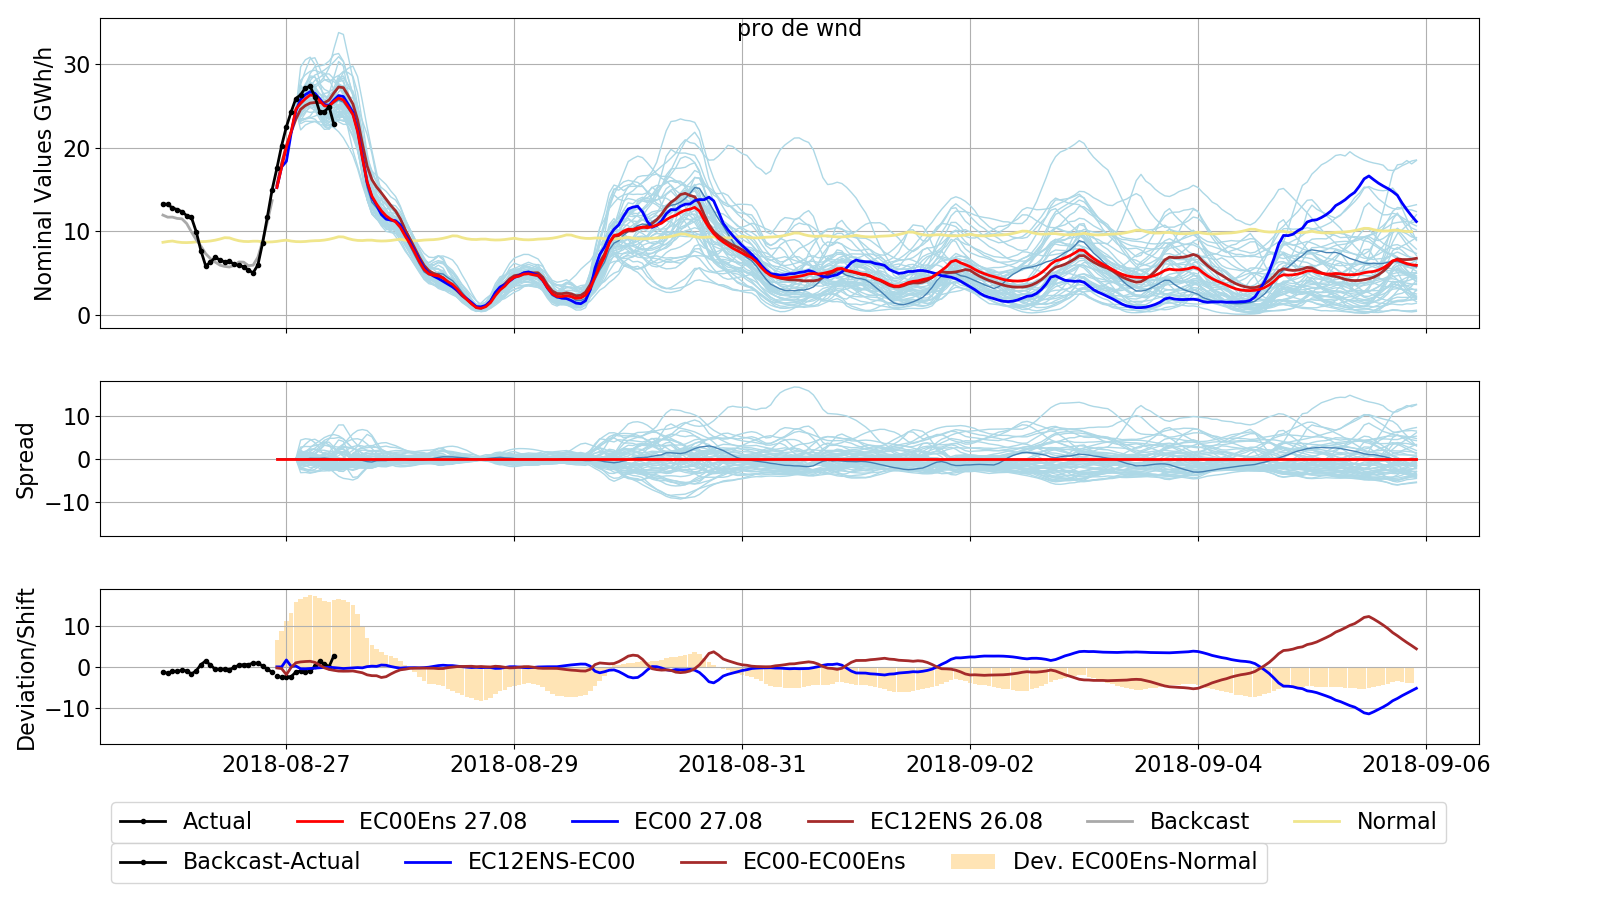
Reproduce figures from volueinsight.com
Reproduce one of the 4 following Fundamental figures for any region ([view on github] ,
[download])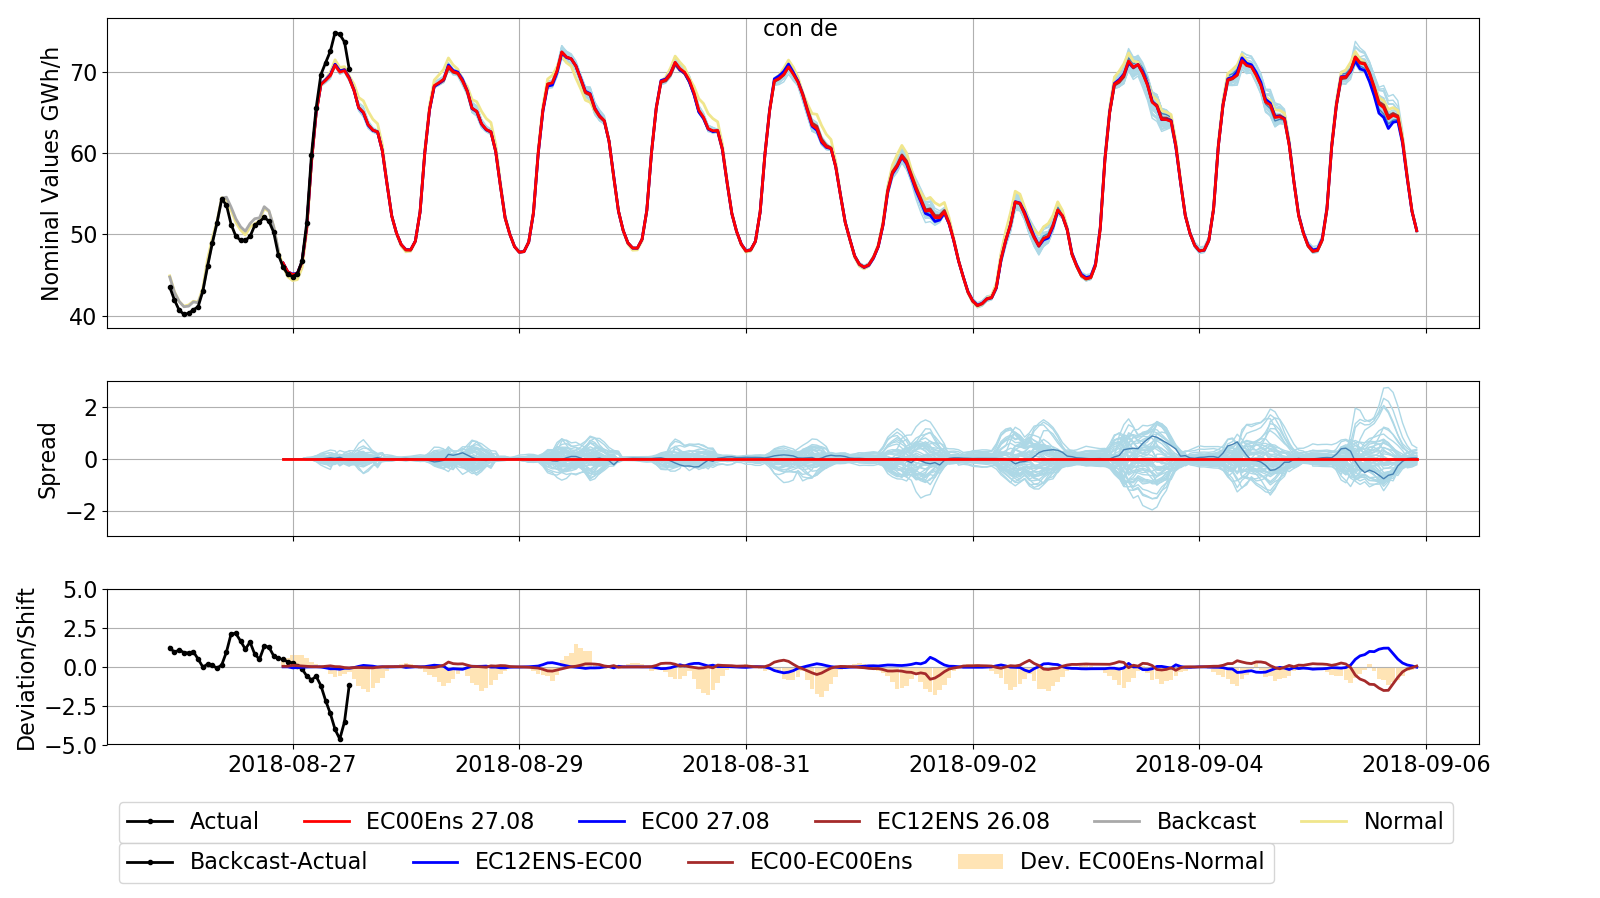
Consumption https://app.volueinsight.com/#tab/power/115/2
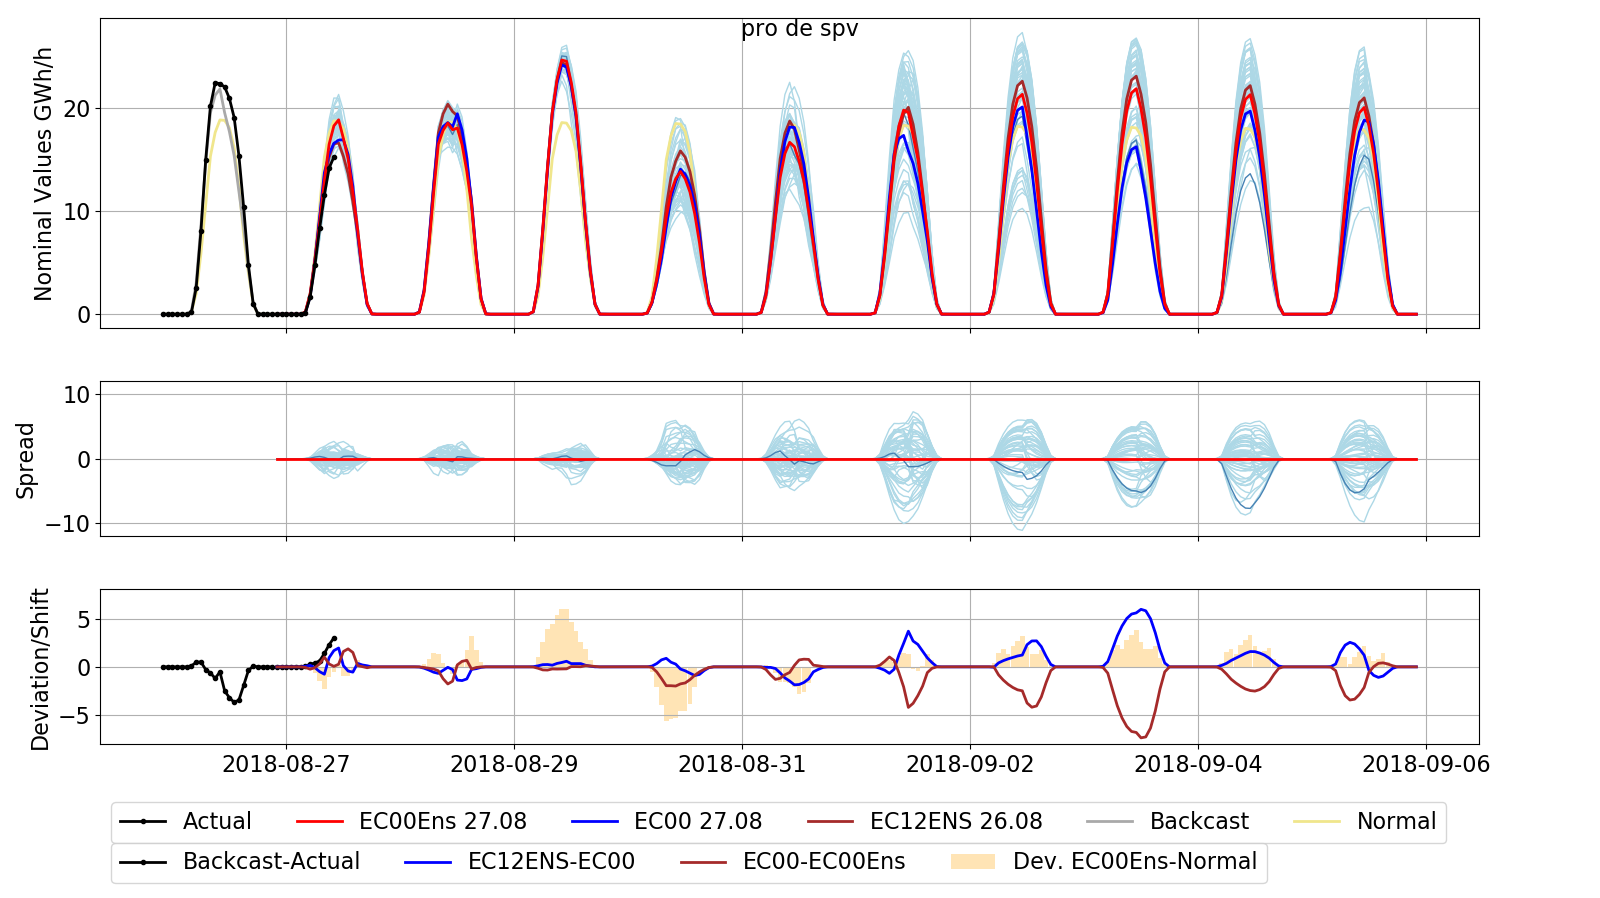
Photovoltaic https://app.volueinsight.com/#tab/power/135/2
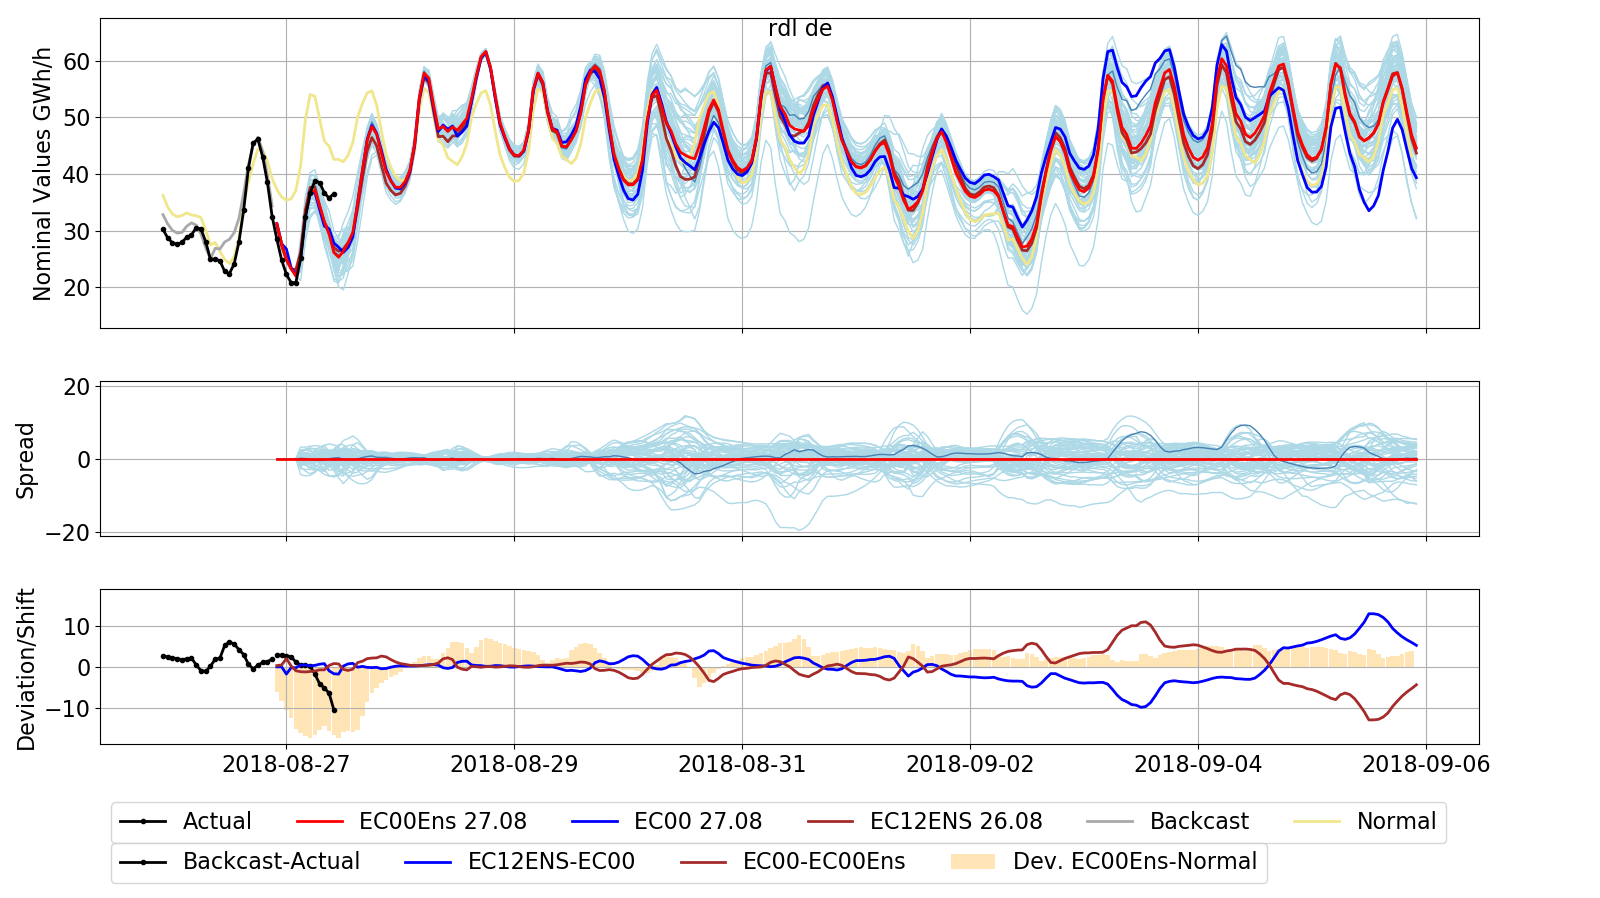
Residual Load https://app.volueinsight.com/#tab/power/109/2
Reproduce temperature figures for any region ([view on github] ,
[download])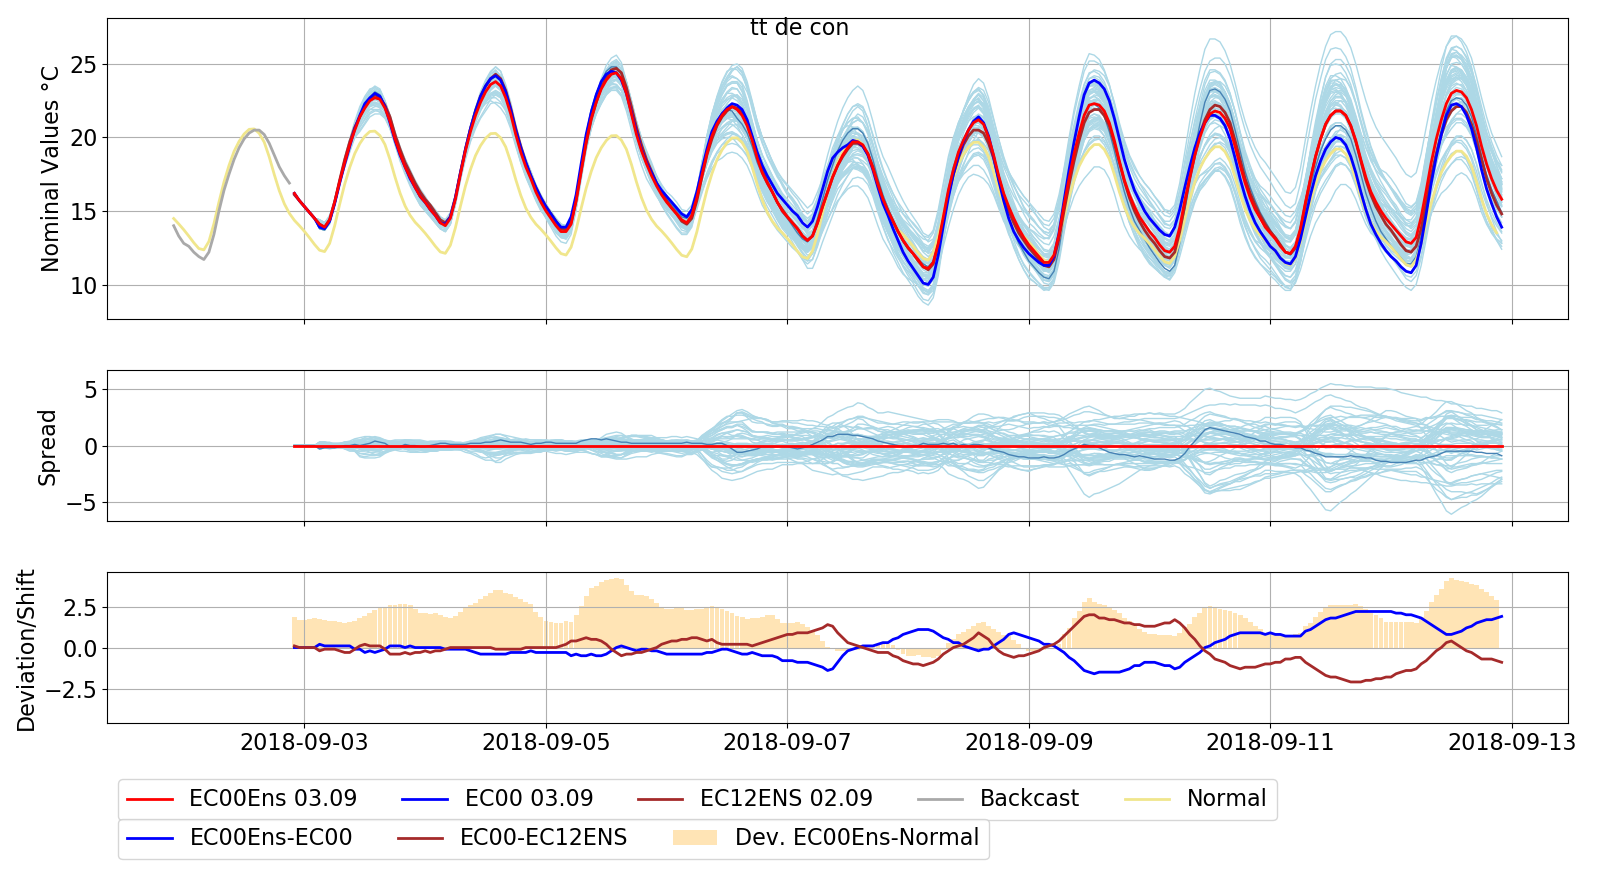
Temperature https://app.volueinsight.com/#tab/power/245/2